docs.konghq.com/kubernetes-ingress-controller/1.1.x/guides/prometheus-grafana/
위의 문서를 통해 Kong Ingress를 사용하며 플러그인으로 Grafana와 Prometheus를 EKS환경에 설치를 했다.
하지만, 위에 예제에서는 Grafana를 portforwading 으로 접근하도록 가이드를 하고 있으나,
production에서는 그럴수 없으니 미리 만들어둔 Ingress에 grafana service를 연결하려고 하였다.
하지만 Ingress에 연결해준뒤에 브라우저에서 /garafana로 접속하면 아래와 같은 에러가 나면서 실행이 되지않았다.
({“message”:“failure to get a peer from the ring-balancer”})
무엇이 문제인가 생각해보았는데 가만히 생각해보니 Grafana service와
연결하려 하는 ingress의 네임스페이스가 달랐다.
Ingress는 test 네임스페이스에 위치해 있었지만,
Grafana와 Prometheus 둘다 monitoring이라고 하는 네임스페이스에 존재했다
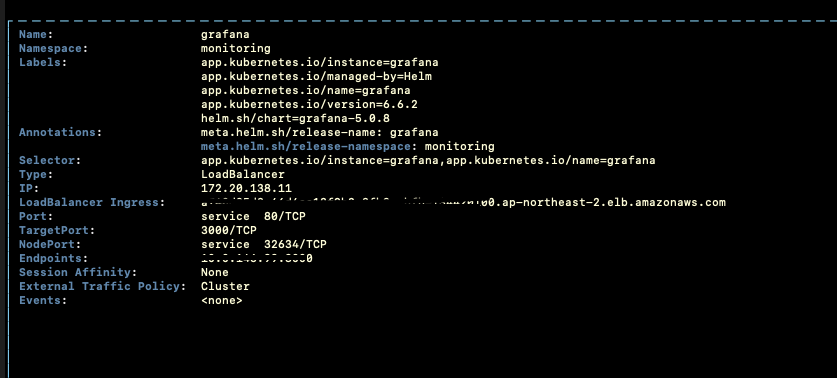
따라서, test 네임스페이스에 있는 Ingress와 monitoring 네임스페이스에 있는 grafana service를 연결해 줘야했다.
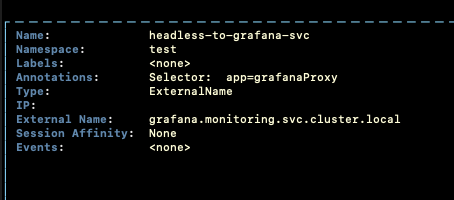
그래서 external service(headless service)를 ingress가 있는 test 네임스페이스에 생성하여
monitoring 네임스페이스에 있는 grafana service를 proxy 하도록 만들어 주어야 한다.
따라서, headless-to-grafana-svc라는 headless service를 아래와 같이 만들어 준다.
그리고 이 headless-to-grafana-svc를 Ingress에 연결해주면 아래와 같이 연결이 된다
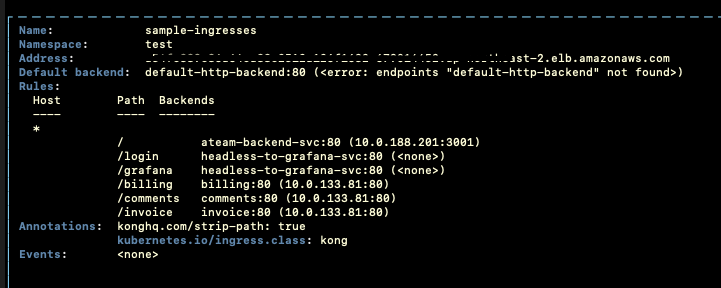
하지만 접속을 하려고 하면 너무 많은 리다이렉션이 된다는 에러와 함께 연결이 되지않는다.
curl로 request 해보면 <a href="/login">Found</a> 가 return 이 된다.
한번 Grafana 문서를 확인을 해보자.
grafana.com/docs/grafana/latest/administration/configuration/
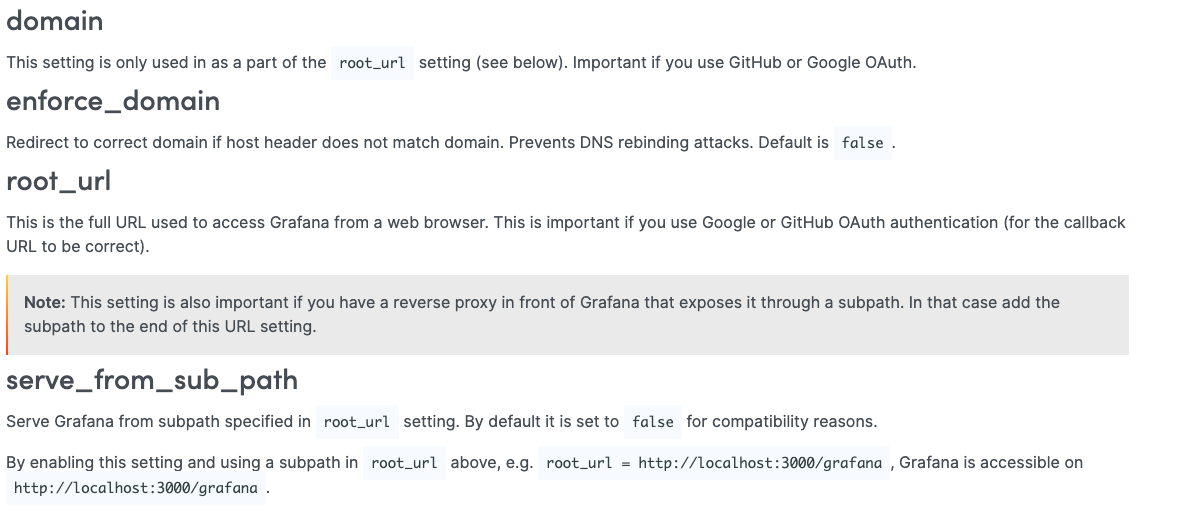
Grafana configuration을 보면 도메인에 연결하여서 접근하려면 ini을 설정해 줘야한다는 사실을 알수있다.
기존에 가이드에서는 아래의 명령어로 grafana를 설치했는데,
우리의 경우에는 도메인 접속을 위해서 명령어에 있는 values에 root_url등을 추가해줘야 한다는 사실을 알수있다.
helm install grafana stable/grafana --namespace monitoring --values http://bit.ly/2FuFVfV --version 5.0.8아래는 위의 명령어중 http://bit.ly/2FuFVfV 의 내용이다
persistence:
  enabled: true
datasources:
  datasources.yaml:
    apiVersion: 1
    datasources:
      - name: Prometheus
        type: prometheus
        url: http://prometheus-server
        access: proxy
        isDefault: true

dashboards:
  default:
    kong-dash:
      gnetId: 7424
      revision: 5
      datasource: Prometheus

dashboardProviders:
  dashboardproviders.yaml:
    apiVersion: 1
    providers:
      - name: "default"
        orgId: 1
        folder: ""
        type: file
        disableDeletion: false
        editable: true
        options:
          path: /var/lib/grafana/dashboards/default
따라서 http://bit.ly/2FuFVfV 에다 grafana.ini: 를 추가해주고,
접속할 domain과 root_url을 추가해준 다음에 yaml로 저장하고 다시 설치해 주자.
persistence:
enabled: true
datasources:
datasources.yaml:
apiVersion: 1
datasources:
- name: Prometheus
type: prometheus
url: http://prometheus-server
access: proxy
isDefault: true
dashboards:
default:
kong-dash:
gnetId: 7424
revision: 5
datasource: Prometheus
dashboardProviders:
dashboardproviders.yaml:
apiVersion: 1
providers:
- name: "default"
orgId: 1
folder: ""
type: file
disableDeletion: false
editable: true
options:
path: /var/lib/grafana/dashboards/default
grafana.ini:
server:
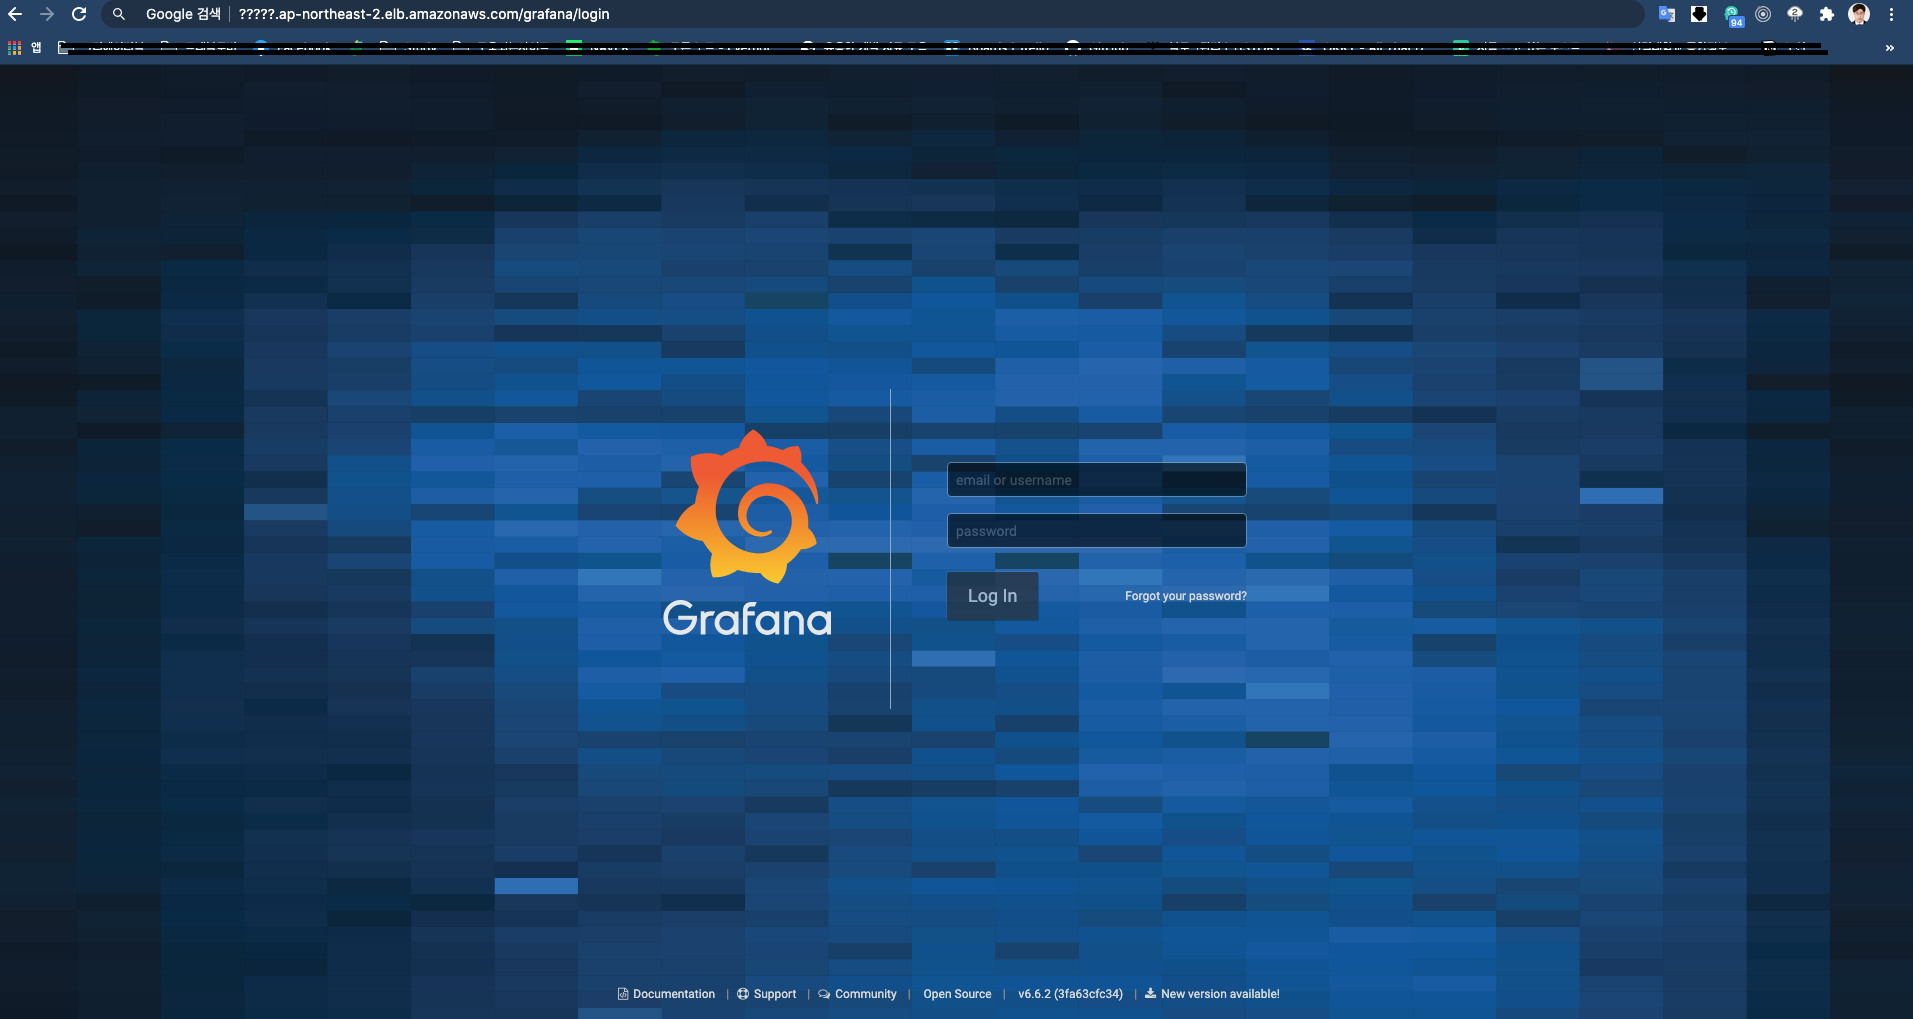
domain: ??????.ap-northeast-2.elb.amazonaws.com
root_url: "http://?????????.ap-northeast-2.elb.amazonaws.com/grafana"
serve_from_sub_path: true다시한번 확인을해주면 ingress에 연결된 도메인/grafana로 grafana dashboard에 정상적으로 접속이 가능하다!
'IT,프로그래밍 > Devops' 카테고리의 다른 글
| [K8S, Grafana, Loki] 쿠버네티스 log monitoring tool Loki 설치법 (0) | 2021.04.08 |
|---|---|
| [K8S] 왜 다른종류의 pod를 같은 service에 두면 안될까? (0) | 2021.03.15 |
| [도커 노트 #2] 컨테이너 사용해보기 (0) | 2021.01.29 |
| [도커 노트 #1] 도커란? (0) | 2021.01.28 |